
What do you think of when you see “Desmos”? Some people might recognize the name, and others (the less fortunate!) might not have. Of the people who recognize it, they might associate it with using it for an assignment or they might just see it as a convenient way to make graph art.
I have been in all of those categories at one point or another…
I would likely be talking about one of my projects if it wasn’t for the fact that most of them are currently under wraps; however, I decided that for this post I’ll take you down memory lane and through some of the adventures I went through and how I developed a lot of the “Desmos tools” I use.
My first interesting graph
The first interesting thing I made with Desmos was an example of epicycloid gears. These types of gears were used in clocks, but their involute cousins currently dominate the market. I was looking into this due to the simplicity of their geometry when compared to involute gears. This makes epicycloid gears ‘easily’ designable, assuming you don’t have a gear generator… which most of the CAD software I have used has, so oh well!
A Continuous Stepping Function?
For some time, I was obsessed with the idea of creating a step function that instead of being discontinuous between values somehow quickly stepped up to the next value. I remember having an application at the time… but it’s been at least 3-4 years since I touched the problem so my memory is failing me. It took many tries before I settled on something, but it was a lot of fun!
Attempt 1: Solid, but not as ‘crisp’ as I would have liked
Attempt 2: Very crisp, but function is slow by Desmos Standards
This project taught me that Desmos runs on a finite amount of resources and can lag. The sawtooth wave, due to how it is constructed, results in Desmos lagging. Little did I know, this would be the thing I would be fighting in many of my future projects!
Kinematics
So one of the first things I did in Desmos was throw a bunch of sticks together and see how they turned when their lengths and turn rates were altered.
This and some design work I was doing with pistons made me want to figure out how to predict movement when some of the lines were constrained and others weren’t. This basically turned into a reverse kinematics problem, so I learned a bit about that while playing around.
0th attempt, mostly just another demonstration: more sticks
1st attempt with stuff actually moving and working: the quadratic equation came in clutch
1st application: piston arm and level ‘simulation.’
The last link, for the piston simulation, is a calculator for determining the piston requirements to lift a certain mass a certain distance from a pivot. It’s not super user friendly though, but if anyone is interested in me making it better let me know!
Robot Pathing
While I was doing some research on robot pathing, I learned about splines, their types, and how they can have different degrees. For instance, quintic Bezier splines represent a 5th order polynomial being used for the parametric equations that define it, with the Bezier just being a specific method to define those parametric equations.
Hardest Project I Worked On: Time for Exploitation
So Desmos is designed to do certain things, right? Well, I decided I wanted to break that mold. One of my friends and I independently discovered a “glitch” in Desmos which allows for-loop like behavior. Using this, I basically solved the raycasting problem with desmos. Here is the final. It doesn’t cover all the edge cases (when the tested point is horizontal with another point) but it can deal with everything else. Some of the equations used were… lengthy. Here are a few of the equations in their full glory:
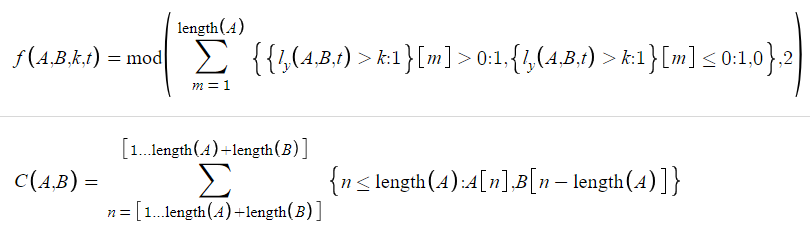
For C(A,B) we see a function that concatenates two input matrices. This is an application of the glitch I was talking about earlier that allowed looping. If you put the same matrix in the top and bottom of a summation, it will actually loop through each of the values in that matrix. I have used this many times since to do technical things or nice visual effects, as in the case of my next big project.
Single Coolest Graph I’ve Made: Feynman’s Lost Lecture
Feynman’s lost lecture, in summary, is a about a geometric proof of simple orbital mechanics. This is a very visually pleasing proof, and if you are interested, here is some reading on the subject. I decided I would do this in Desmos to apply myself, and I did it one late night I should have been studying for chemistry: Feynman’s Lost Lecture. Feel free to play around with the different sliders. J controls the “animation,” h controls the number of lines, r controls the size, and the black dot can be dragged to any location.
Miscellaneous Graphs
And because I have done so many other ones, I’ll just link them. For the calculators, just let me know if you’d be interested in me cleaning them up. I’ll make an update post if I do.
- Naive Geometric Oval reflection proof
- Gompertz curve
- Another Squashing Function
- Pong
- Bad Mandelbrot Set (This will take a longish time to load)
- Ball Shooter Calculator (not including air resistance)
- Alphabet (Set the visibility of the character you want to view on the side)
- Firework Function (Another application of the loop)
- O-Ring Friction Torque Calc (COULD BE WRONG just something I threw together)
- Happbee Christmas
- Everything is Fine (Still working on this one)